
¡Oferta!
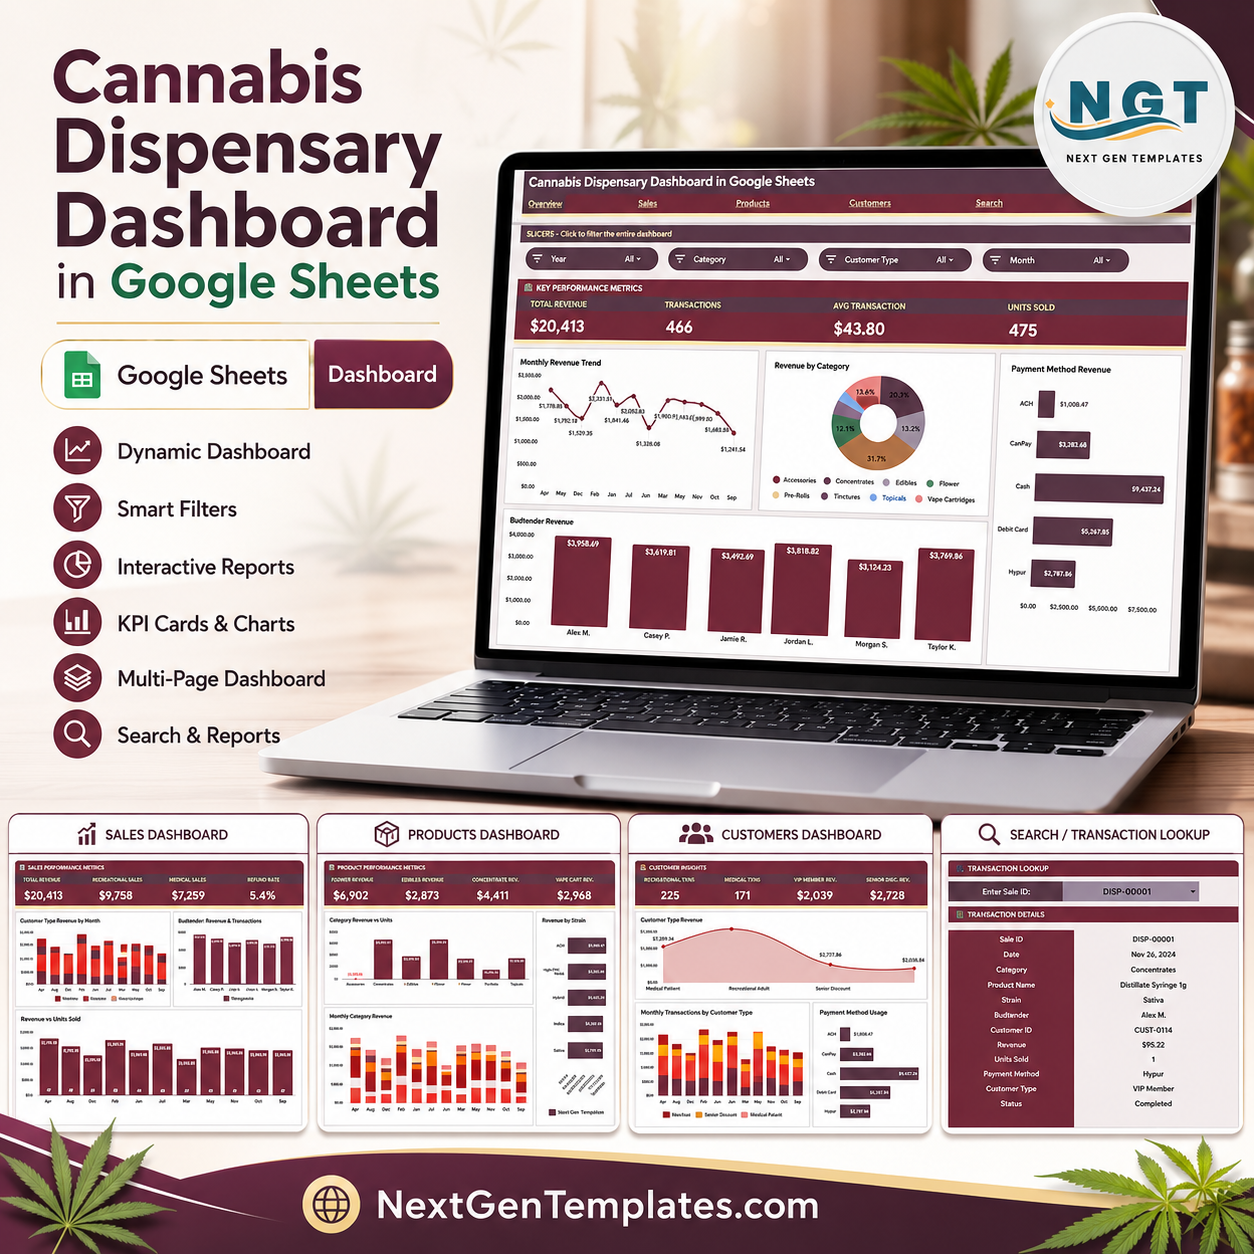
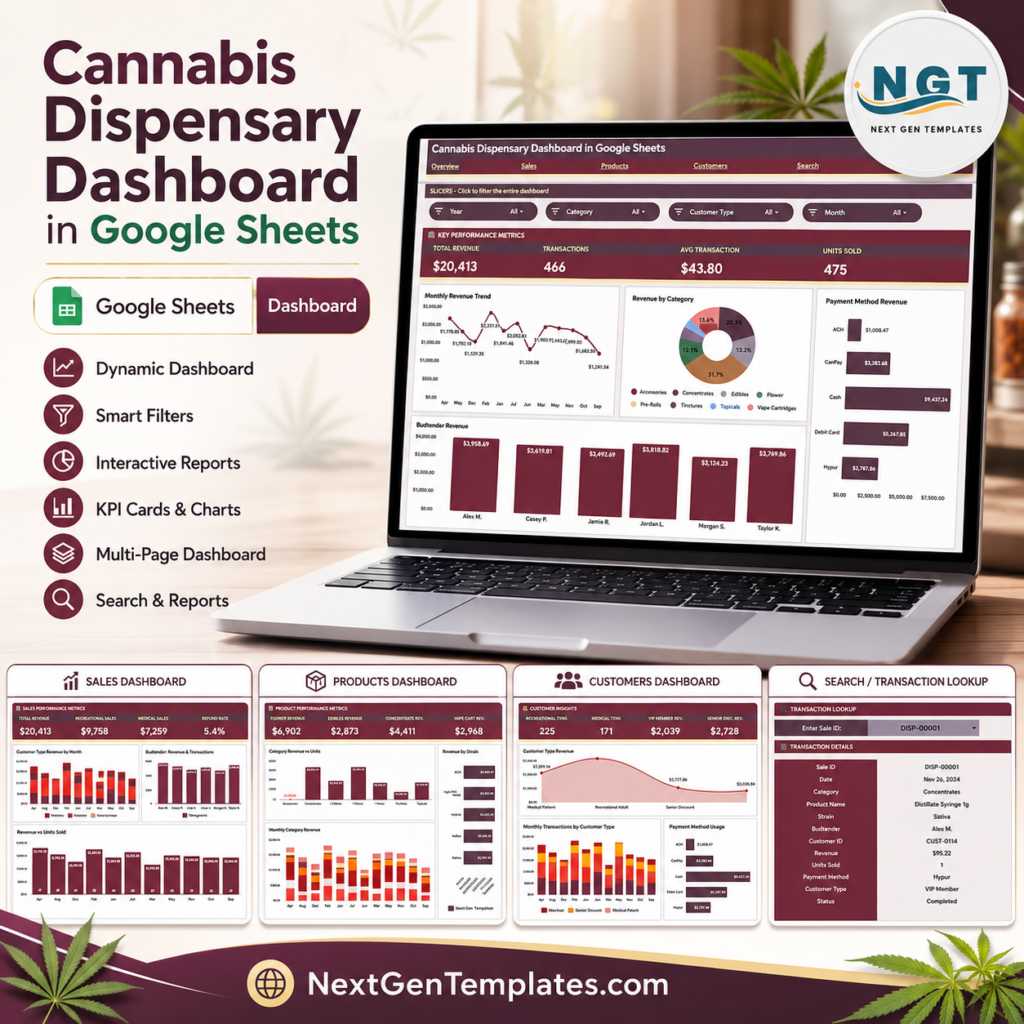
Cannabis Dispensary Dashboard in Google Sheets
$ 9.43
The Cannabis Dispensary Dashboard in Google Sheets tracks 4 core KPIs across 6 interactive pages, with 10 pre-built charts and dynamic slicers that let budtenders and managers filter revenue, transactions, and product performance in seconds. Setup takes under 10 minutes — paste your sales data into the Data Sheet and every chart updates automatically. �� Join 8,400 teams in 40 countries using NextGenTemplates to replace paid SaaS tools with one-time-purchase Google Sheets, Excel, Power BI, and HTML templates. ✅ Instant download · One-time payment · No subscription · No per-user fees · Lifetime access �� Key Features of the Cannabis Dispensary Dashboard in Google Sheets �� 4 KPI Summary Cards — The Overview page displays Total Revenue, Transactions, Average Transaction Value, and Units Sold so you see the business health at a glance. All four KPIs respond to slicer selections instantly, giving filtered snapshots without manual recalculation. �� Dynamic Slicers for Fast Filtering — The dashboard includes native Google Sheets slicers that filter by Date, Category, Payment Method, and Budtender simultaneously. No formulas to edit — click a slicer chip and the entire dashboard refreshes in under a second. �� Budtender Performance Tracking — The Sales page shows Revenue and Transactions by Budtender, making it easy to identify top performers, set targets, and plan staff scheduling. This is one of the most requested features for cannabis retail analytics. �� Product and Strain Analysis — The Products page breaks down Revenue and Units by Category, Revenue by Strain, and Revenue by Category and Month, giving buyers and merchandisers the data they need to optimize stock levels and promotions. �� Customer Segmentation — The Customers page reveals Revenue by Customer Type, Revenue by Payment Method, and Transactions by Customer Type — essential for loyalty program decisions and payment acceptance strategy. �� Instant Sale Lookup — The Search Sheet lets staff enter any Sale ID and instantly displays Date, Category, Product Name, Strain, Budtender, Customer ID, Revenue, Units Sold, Payment Method, Customer Type, and Status. No more scrolling through raw data. �� What’s Inside the Cannabis Dispensary Dashboard in Google Sheets Page 1: Overview The Overview page displays 4 KPI cards — Total Revenue, Transactions, Avg Transaction, and Units Sold — along with 4 key charts: Revenue by Month, Revenue by Category, Revenue by Payment Method, and Revenue by Budtender. Dynamic slicers at the top filter the entire page in one click. Page 2: Sales Analysis The Sales page provides deeper analysis across three views: Revenue by Customer Type, Revenue and Transactions by Budtender, and Revenue and Units Sold by Month — allowing managers to assess staff performance and monthly sales trends side by side. Page 3: Products Analysis The Products page shows Revenue and Units by Category, Revenue by Strain, and Revenue by Category and Month — giving buyers and category managers a clear picture of which strains and product lines are driving the most value. Page 4: Customers Analysis The Customers page analyzes Revenue by Customer Type, Revenue by Payment Method, and Transactions by Customer Type — providing dispensary owners with the insights needed to refine loyalty programs, payment acceptance, and customer retention strategies. Page 5: Search Sheet The Search Sheet enables instant transaction lookup by Sale ID. Enter or select any Sale ID and the dashboard immediately displays the full transaction record — Date, Category, Product Name, Strain, Budtender, Customer ID, Revenue, Units Sold, Payment Method, Customer Type, and Status. Data Sheet The Data Sheet is where you enter your dispensary’s sales records in the provided format. Columns cover all key fields the dashboard uses, including Date, Category, Product Name, Strain, Budtender, Customer ID, Revenue, Units Sold, Payment Method, Customer Type, and Status. �� Cannabis Dispensary Dashboard in Google Sheets vs. Excel Dashboard vs. Paid Cannabis POS — Where This Fits Feature Cannabis Dispensary Dashboard (Google Sheets) Excel Dashboard Paid Cannabis POS/Analytics (Leafly, Flowhub) Cost $9.99 one-time $17.99 one-time $200–$500 per month Platform ✅ Google Sheets (browser mobile) Requires MS Excel desktop Proprietary SaaS platform Setup time ✅ Under 10 minutes Under 15 minutes Days to weeks (onboarding POS setup) Real-time team collaboration ✅ Yes — native Google Sheets sharing Limited (OneDrive required) ✅ Yes (cloud-native) Budtender performance tracking ✅ Built-in ✅ Built-in ✅ Built-in Strain-level revenue analysis ✅ Revenue by Strain ✅ Yes ✅ Yes Customizable fields ✅ Fully customizable ✅ Fully customizable Limited to platform fields Year-1 cost at 5 users $9.99 total $17.99 total $12,000–$30,000 No vendor lock-in ✅ Your data, your file ✅ Your data ❌ Data held by vendor For dispensary operators who want professional revenue and performance analytics without paying SaaS prices, the Cannabis Dispensary Dashboard in Google Sheets sits in the sweet spot. �� Who This Template Is For — and Who It’s Not For ✅ This template is built for: Cannabis dispensary owners and managers tracking daily revenue, transactions, and product performance Budtenders and sales teams who need quick access to individual transaction lookup via the Search Sheet Multi-location operators who want a low-cost reporting layer on top of their existing POS export data Finance and compliance teams needing monthly revenue summaries by category, strain, and payment method ❌ This template is NOT for: Dispensaries that need a full POS system with real-time inventory management (use Leafly, Flowhub, or Cova) Operations requiring automatic POS data sync without manual CSV export/import Enterprise cannabis groups requiring SOC 2 compliance and SSO authentication ⚙️ How to Use the Cannabis Dispensary Dashboard in Google Sheets Download the PDF guide from your purchase — it contains the Google Sheets copy link. Click the link to make your own editable copy in Google Drive. Open the Data Sheet tab and enter or paste your dispensary sales records in the provided format. Use the slicers on the Overview page to filter by Date, Category, Payment Method, or Budtender. Navigate through the Sales, Products, and Customers tabs for deeper analysis. Use the Search Sheet to look up any individual sale by Sale ID instantly. �� Real-World Use Cases Maria manages operations at a 3-location cannabis dispensary in Colorado. She exports weekly sales data from her POS and pastes it into the Data Sheet. Within seconds she can see which strains are driving the most revenue by location, which budtenders are hitting their targets, and whether recreational vs. medical customers are trending differently — all without paying $300/month for a BI platform. Jordan runs a single-location dispensary and handles his own books. He uses the Cannabis Dispensary Dashboard in Google Sheets to prepare his monthly investor report. The Revenue by Month and Revenue by Category charts give him exactly the visuals he needs for his slide deck, and the Customer Type breakdown shows his loyalty card program is converting walk-ins to repeat buyers. A dispensary compliance officer uses the Search Sheet every day. When auditors request transaction-level records, she enters the Sale ID and pulls up the complete record — Date, Product, Strain, Payment Method, and Status — in under 5 seconds, cutting audit response time significantly. ❓ Frequently Asked Questions What KPIs does the Cannabis Dispensary Dashboard in Google Sheets track? The Cannabis Dispensary Dashboard in Google Sheets tracks 4 core KPIs — Total Revenue, Transactions, Average Transaction Value, and Units Sold — displayed as cards on the Overview page. All four update automatically when you filter via slicers or update the Data Sheet with new records. Do I need any paid tools or add-ons to use this dashboard? No. The Cannabis Dispensary Dashboard in Google Sheets runs entirely in free Google Sheets. There are no paid add-ons, no macros requiring special permissions, and no desktop software required. All you need is a free Google account. How does this compare to paid cannabis analytics tools like Leafly or Flowhub? Paid platforms like Leafly or Flowhub offer real-time POS integration but cost $200–$500 per month. This dashboard costs $9.99 as a one-time purchase and is ideal for operators who export POS data to CSV and want professional reporting without ongoing subscription fees. Can I track budtender performance with this template? Yes. The Sales page includes a Revenue and Transactions by Budtender chart that makes it easy to compare individual budtender performance, identify top earners, and spot underperformers — all from your existing sales data. How long does setup take? Setup takes under 10 minutes. After copying the template to your Google Drive, open the Data Sheet tab, paste your sales records in the provided format, and the dashboard updates automatically. The slicers are pre-configured and require no additional setup. Can I customize the template to add my own categories or fields? Yes. Because the Cannabis Dispensary Dashboard in Google Sheets is built on native Google Sheets pivot tables and formulas, you can add new product categories, payment methods, or customer types to the Data Sheet and they will automatically appear in the charts and filters. �� About the Author Built by PK — Microsoft Certified Professional with 15 years of Excel, Google Sheets, and Power BI experience. Founder of NextGenTemplates, reaching 300K subscribers across YouTube channels (@PK-AnExcelExpert, @NextGenTemplates, @NeoTechNavigators). Every template is hand-built and tested before release. �� Explore Related Templates Looking for more Google Sheets Dashboards? Here are some you might also like: Drop Shipping Dashboard in Google Sheets — track orders, revenue, and supplier performance for e-commerce businesses. Social Media Influencer Tracking Dashboard in Google Sheets — monitor influencer KPIs and campaign ROI. Music School Dashboard in Google Sheets — student enrollment, revenue, and class performance analytics. �� Click here to read the Detailed Blog Post Watch the step-by-step video Demo: �� Visit our YouTube channel for step-by-step video tutorials �� YouTube.com/@NeoTechNavigators �� Last updated: June 2026
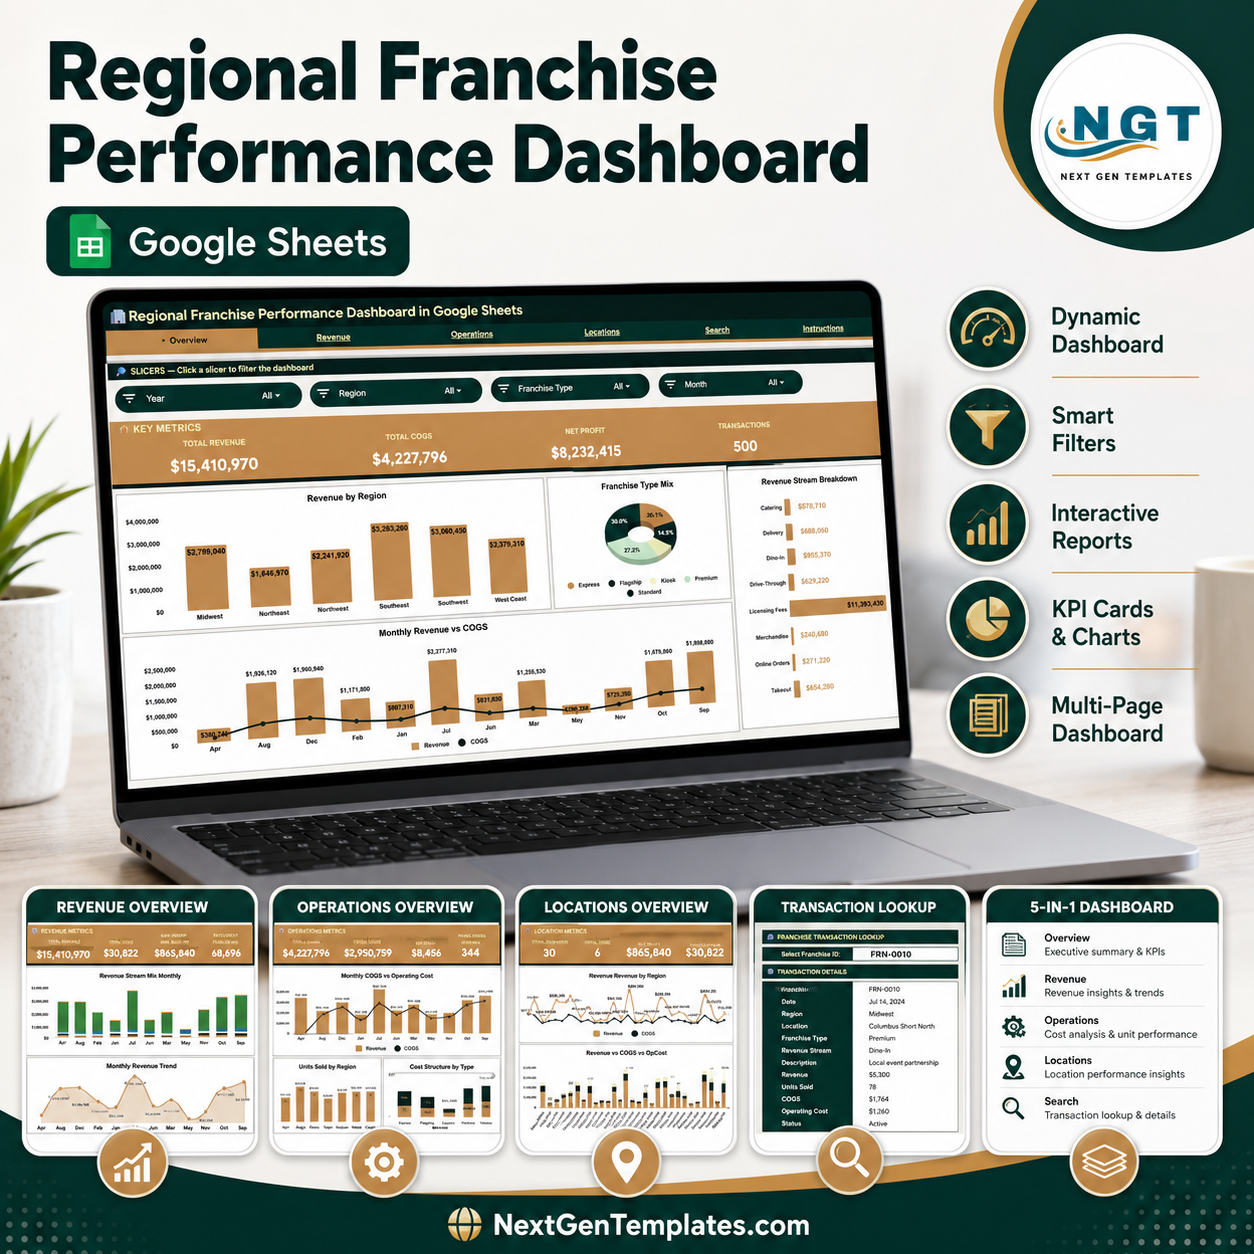 Regional Franchise Performance Dashboard in Google Sheets
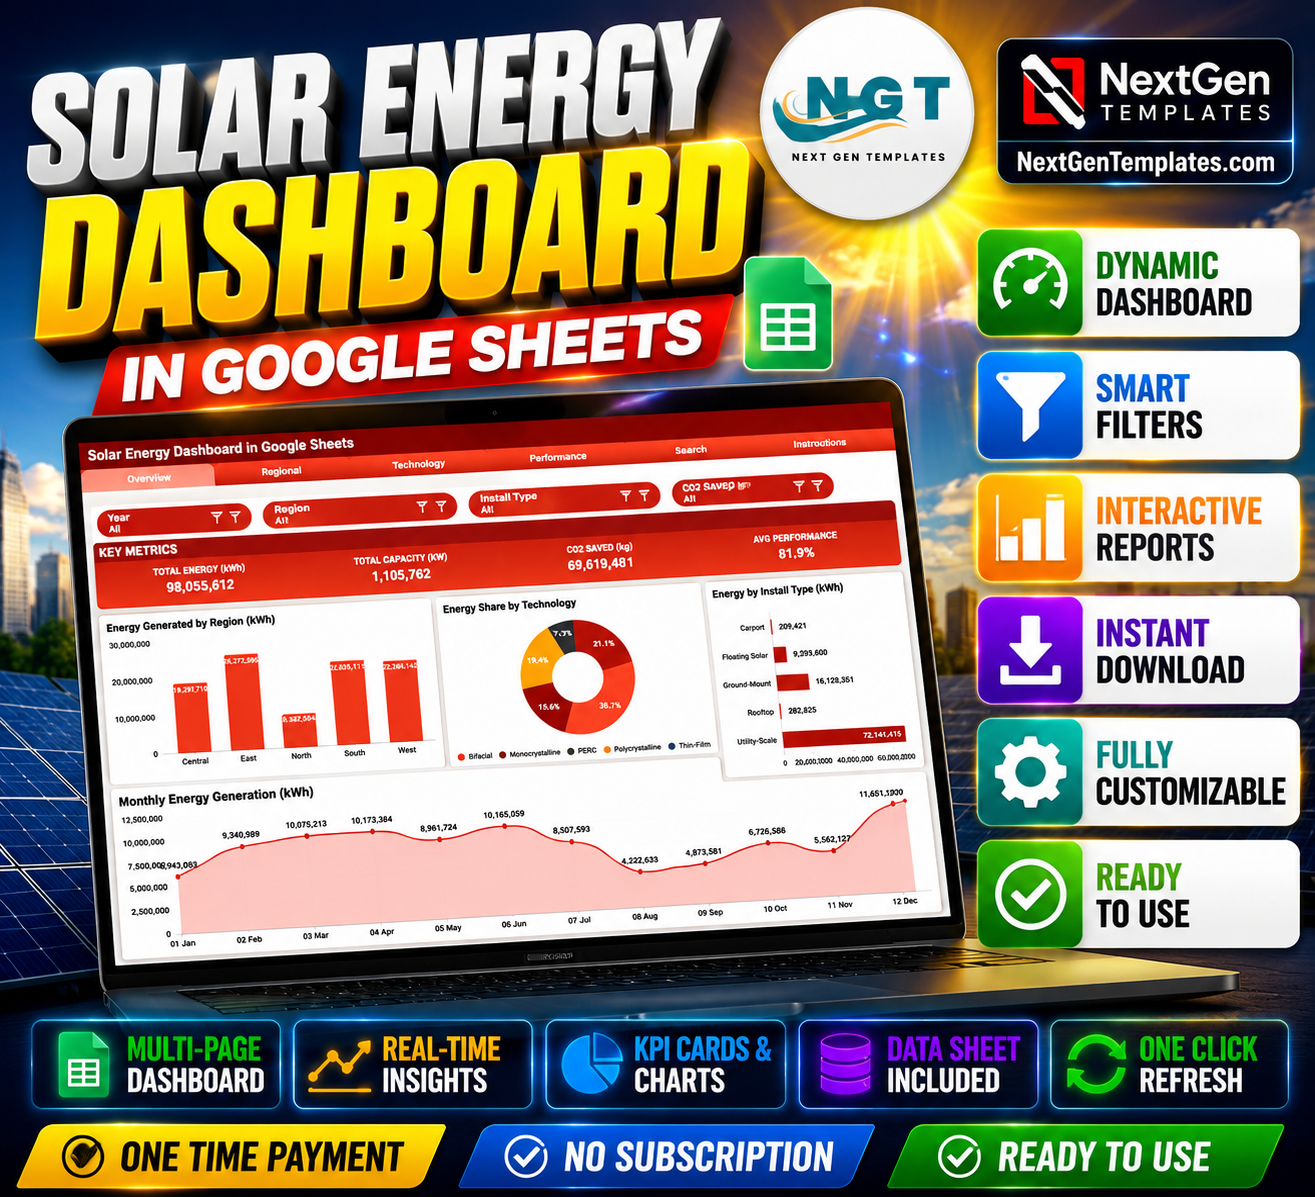 Solar Energy Dashboard in Google Sheets
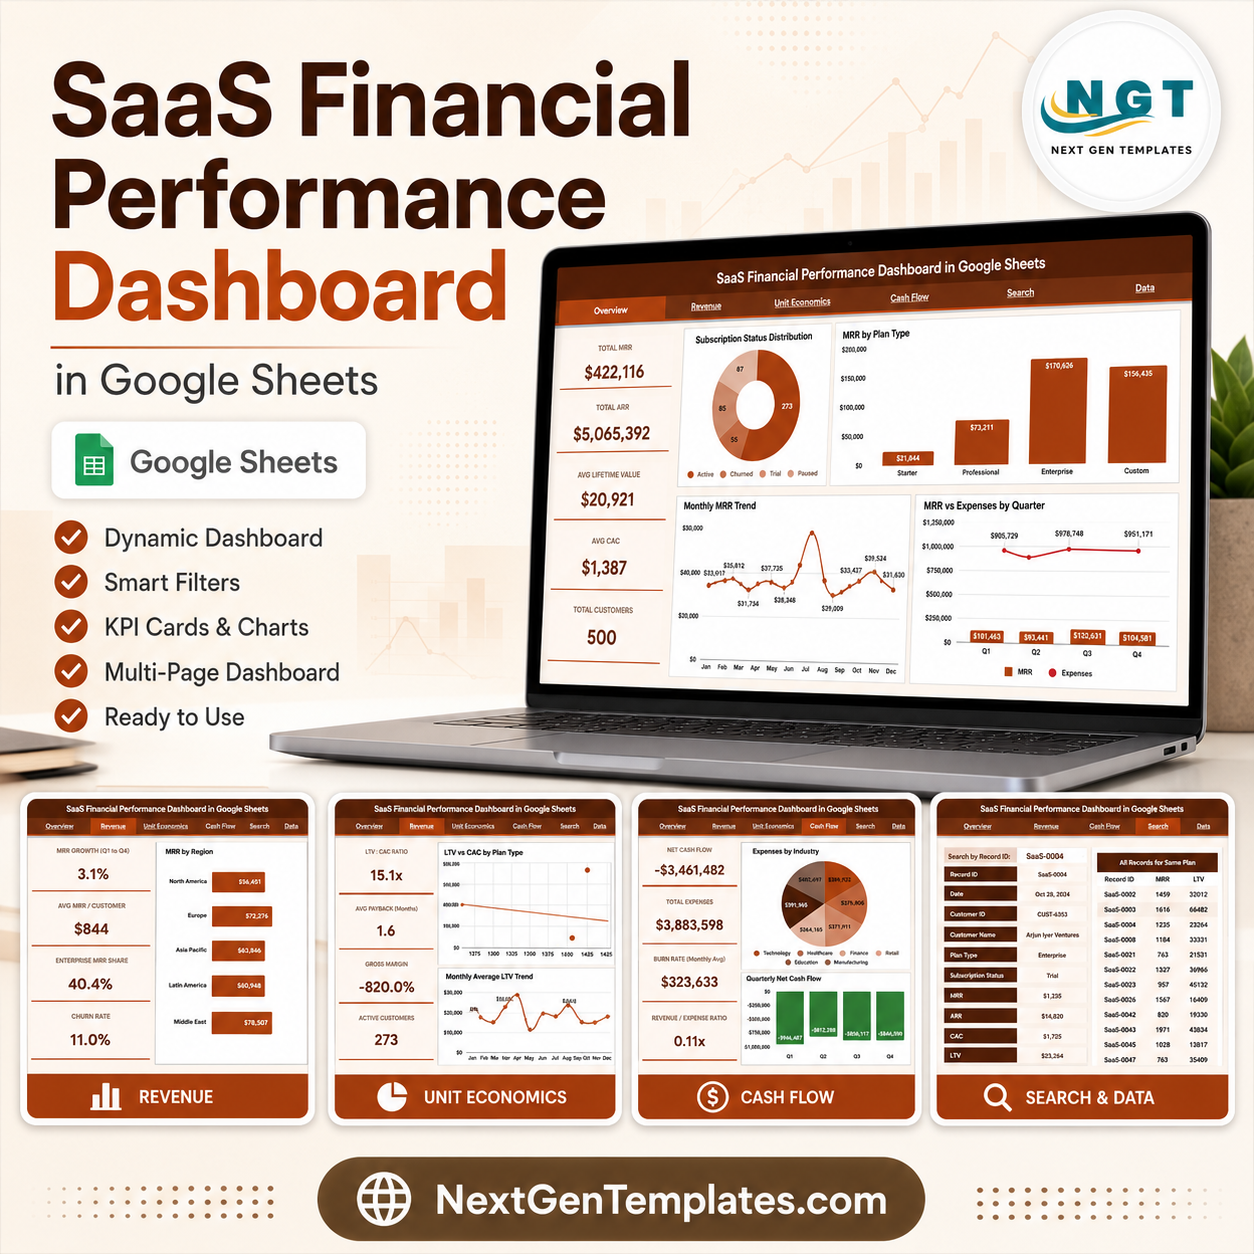 SaaS Financial Performance Dashboard in Google Sheets
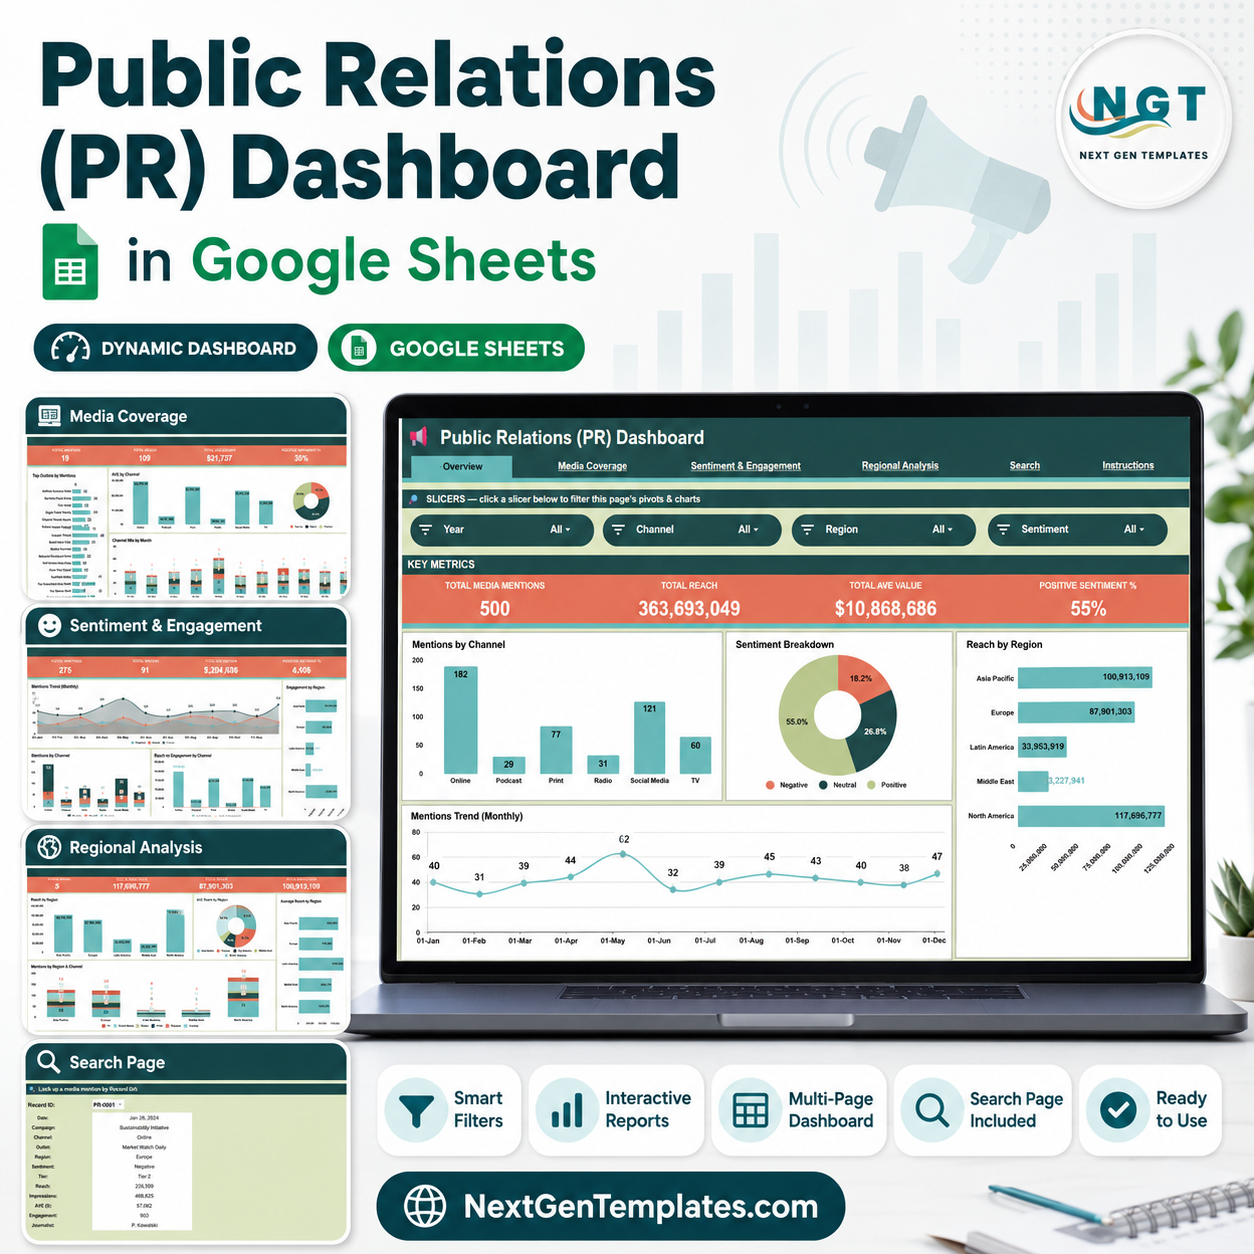 Public Relations (PR) Dashboard in Google Sheets